Building an Analytics Pipeline in 2015
August 06, 2015 | Andy Granowitz
Every company needs an analytics data platform queryable by SQL.
Using a single analytics tool or relying on logs from a single source is a fast way to get started but is rarely sufficient. You’ll realize you need a better data strategy when attempting more detailed analytics tasks: cohorting customers based on segments available in multiple data sources, analyzing long time scale trends, or making data available to other applications. Unfortunately, you’ll quickly reach the limit of your off-the-shelf tool.
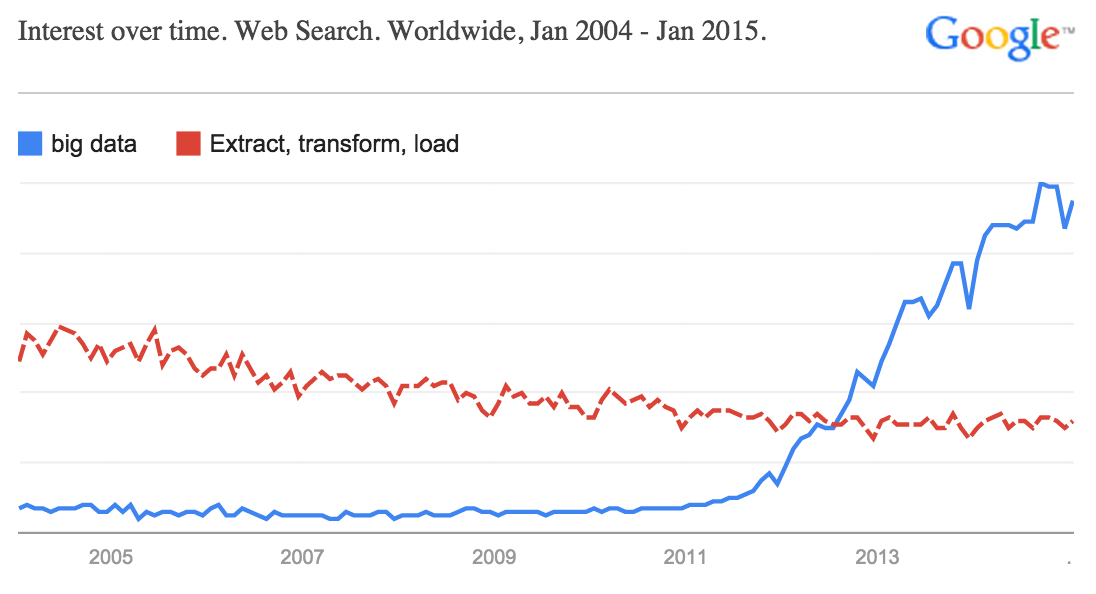
There has been a dramatic increase in data being created and fascination with Big Data, but less of a corresponding uptick in how to capture its value. Engineering a system to ingest, transform, and process data from many (changing, flaky) sources has been a long time, Very Hard Problem™. Doing this well requires hard work – the dreaded ETL.
We see more and more companies choosing to invest in SQL warehouses and the requisite engineering well before they become large businesses. How do you effectively build one of these things? And what makes building robust analytics infrastructure difficult?
Here’s an example illustrating the core problems: You implemented a new purchase flow in your app and you’d like to understand conversion rates (tracked from logs) broken down by your email marketing A/B test (tracked from a 3rd party). The log lines you’re generating have new structure and may need to be re-parsed to fit into your existing schema. The A/B testing info may live in a different place than user data. Boiler plate reporting tools and drag and drop analytics UIs are great, but they require structuring ahead of time and the new checkout flow change is already live in production. Manually doing this analysis one time is annoying, but turning it into a reliable, repeatable practice is nearly impossible without dedicated engineering effort.
Your goal should be to get your data into a data warehouse that can be queried directly by people and programs. While it’s not straightforward, it’s important to understand the pieces. We see companies addressing this problem by focusing on the following steps:
- For each data source: generate, collect, and store your data
- Transform data into usable, queryable form
- Copy multiple sources into a single place
- Enjoy the data fruits of your data labor
The first step is collecting the data with as much structure as possible. You need to generate the data, transmit it from apps, browsers, or services for collection, and then safely store it for later. Many mobile and web analytics providers offer these three steps, others focus on a subset. For example, Heap and Mixpanel generate many app usage events automatically. Others focus on receiving data and making it available to read later (Keen and Splunk as different examples). Segment takes advantage of the difficulty of logging to many places by transmitting data to many of the above services with one API call.
Another large source of data is logs (usually messy and unstructured). Just having logs is not enough - it must be massaged into usable rows and columns. Some log lines help engineers analyze technology performance or debug errors, some log lines must be interpreted to signal “human” events, and some log lines have been around for so long that no one remembers why they’re there. Logs are rarely generated with their end purpose or a fixed type system in mind. Transformation of these raw strings is necessary to make them usable rather than just searchable.
For example, you may need to combine three separate log lines in order to signal a successful-user-flow, or to compare log lines against prior data to understand if a user is new, active or re-activated. Or maybe you need to remove those extra pesky spaces around your beautiful integers or standardize timestamps across timezones. Trifacta, Paxata, and Tamr offer technical tools for transforming ugly log forms to structured rows and columns. Or you’ll roll your own.
Once data collection systems are in place, you want to get this data flowing into a data warehouse. While some of the aforementioned tools provide their own interface for accessing collected and processed data, joining across multiple sources is difficult if not impossible, and their interfaces are often inflexible and cumbersome. Luckily, many of these services recognize this, and offer easy exports to data warehouses. Amplitude and Segment do this well and offer straightforward exports to Redshift. Google Analytics offers export to BigQuery for Premium customers (~$150k / year). Others make it possible, but require a bit of work (for example, Keen). New startups like Textur and Alooma are working on plumbing data into hosted RDBMS systems.
Outside of dedicated analytics solutions, you often have data from third party sources you’d like to join and analyze (e.g. Salesforce, ZenDesk, MailChimp, etc.). Most of these tools offer APIs to extract data. Building and maintaining these connections from 3rd parties to your data warehouse on your own is doable, but this is often where data integration tools are helpful. Services like Snowplow and Fivetran help.
At this point, data is flowing in a structured way. But where is it going? When assessing a data warehouse, look for:
- Large scale ingestion and storage
- Fast computation and multi-user concurrency
- Easy management and scaling with data
- Security and permissioning
There are many that meet these criteria: Amazon Redshift, Google BigQuery, Microsoft Azure SQL Data Warehouse, Hive, Spark, Greenplum, Vertica, Impala (the list goes on!). The largest technology companies (Amazon, Google, Microsoft) are investing in, and subsidizing, these data warehousing solutions. It’s a crucial component to nearly every business, which naturally draws the attention of the tech titans.
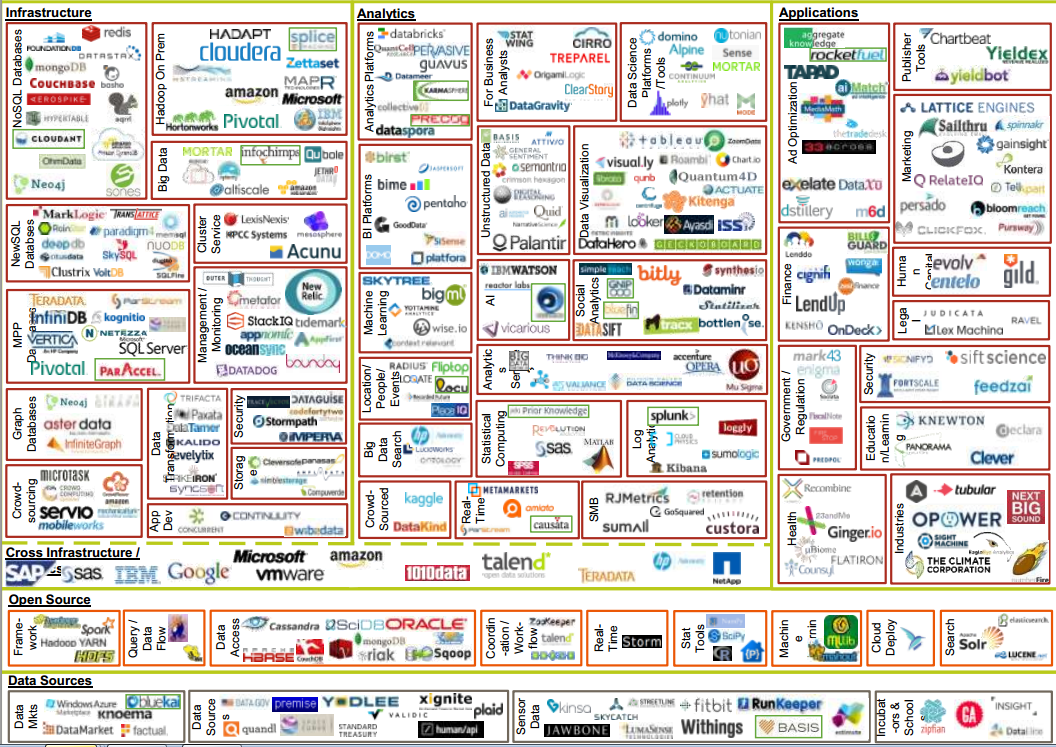 It’s a data jungle out there. Diagram from 2014 by Matt Turck at FirstMark
Phew, now you can enjoy the freedom of querying structured data, and the work (and fun!) begins. We’ll have more on the data analysis step soon!
We’d love to hear how you’re tackling these problems. What are your favorite tools? Where are your most painful pains? Tweet at @WagonHQ or send us a note at hello@wagonhq.com!